
London and the South - little change
by Brian Durrans
In London, Labour retained marginals like Battersea and Dagenham & Rainham, held onto safer seats but with lower majorities, yet won only Putney. In 2017 it gained Kensington by a mere 20 votes but has now lost it to the Tories by 150 votes. This was made possible by the LibDem candidate, a former Tory Remainer whose penance for jumping ship was to split the anti-Tory vote. Not even being a vocal Remainer in a constituency that voted 2:1 Remain in 2016 was enough to save Labour’s Emma Dent Coad. Labour also failed to dislodge former Conservative leader and reviled architect of Universal Credit Iain Duncan Smith from Chingford & Woodford Green which had been almost evenly split between Leave and Remain in the referendum.
Overall, there was little change to London seats. The Conservatives lost two and won two, equally to and from Labour and the LibDems. Neither Green nor Brexit Parties nor the long-running pernicious attacks on Labour and Corbyn over alleged anti-semitism in the Party, or weakness towards it, resulted in any changes to London seats, and except for Kensington alone the LibDems didn’t change the outcome where Labour and Tories were the main contenders.
It was much the same picture in the rest of the south, where Labour did both slightly worse (not gaining a seat) and slightly better (not losing one) than in London but much better than in the calamitous performance in its northern “Red Wall”. In southern England outside London, Labour retained fourteen seats, mostly with turnouts well above the national average and in ten of them with over half the vote. In all fourteen, the Conservative candidate came second and the LibDem trailed a poor third, gaining too few votes to have a made a difference even if all those votes had “tactically” gone to the Tory instead. These were mainly cities or larger towns with younger (some including students) and more working-class voters than in more rural seats in the same region. Only three of these Labour-held constituencies voted Leave in 2016 (Slough, Portsmouth South, Plymouth Sutton & Devonport) and in ten of the rest which voted Remain, the Leave vote was above 40%. (1) Interpreting these outcomes is a challenge but whatever the extent of the “Brexit factor” - compared with other issues like the NHS and economic plans on which Labour focused its efforts - it seems mainly to have reinforced the Party in seats it already held in this part of the country where the only serious competition were Tories.
The votes and changes in vote-share in London and the south over the last four general elections are shown in the accompanying table. (2)
(2) Data for 2019 are mainly from the BBC. Data for earlier years are from several sources, including YouGov, Wikipedia and the Electoral Reform Society. In the case of votes cast, figures for southern England are combined from SE and SW regions; regarding turnout and changes in vote share, the average of these two regional figures, rounded up to a single decimal place. The regional figures ignore any changes in constituency boundaries between elections.
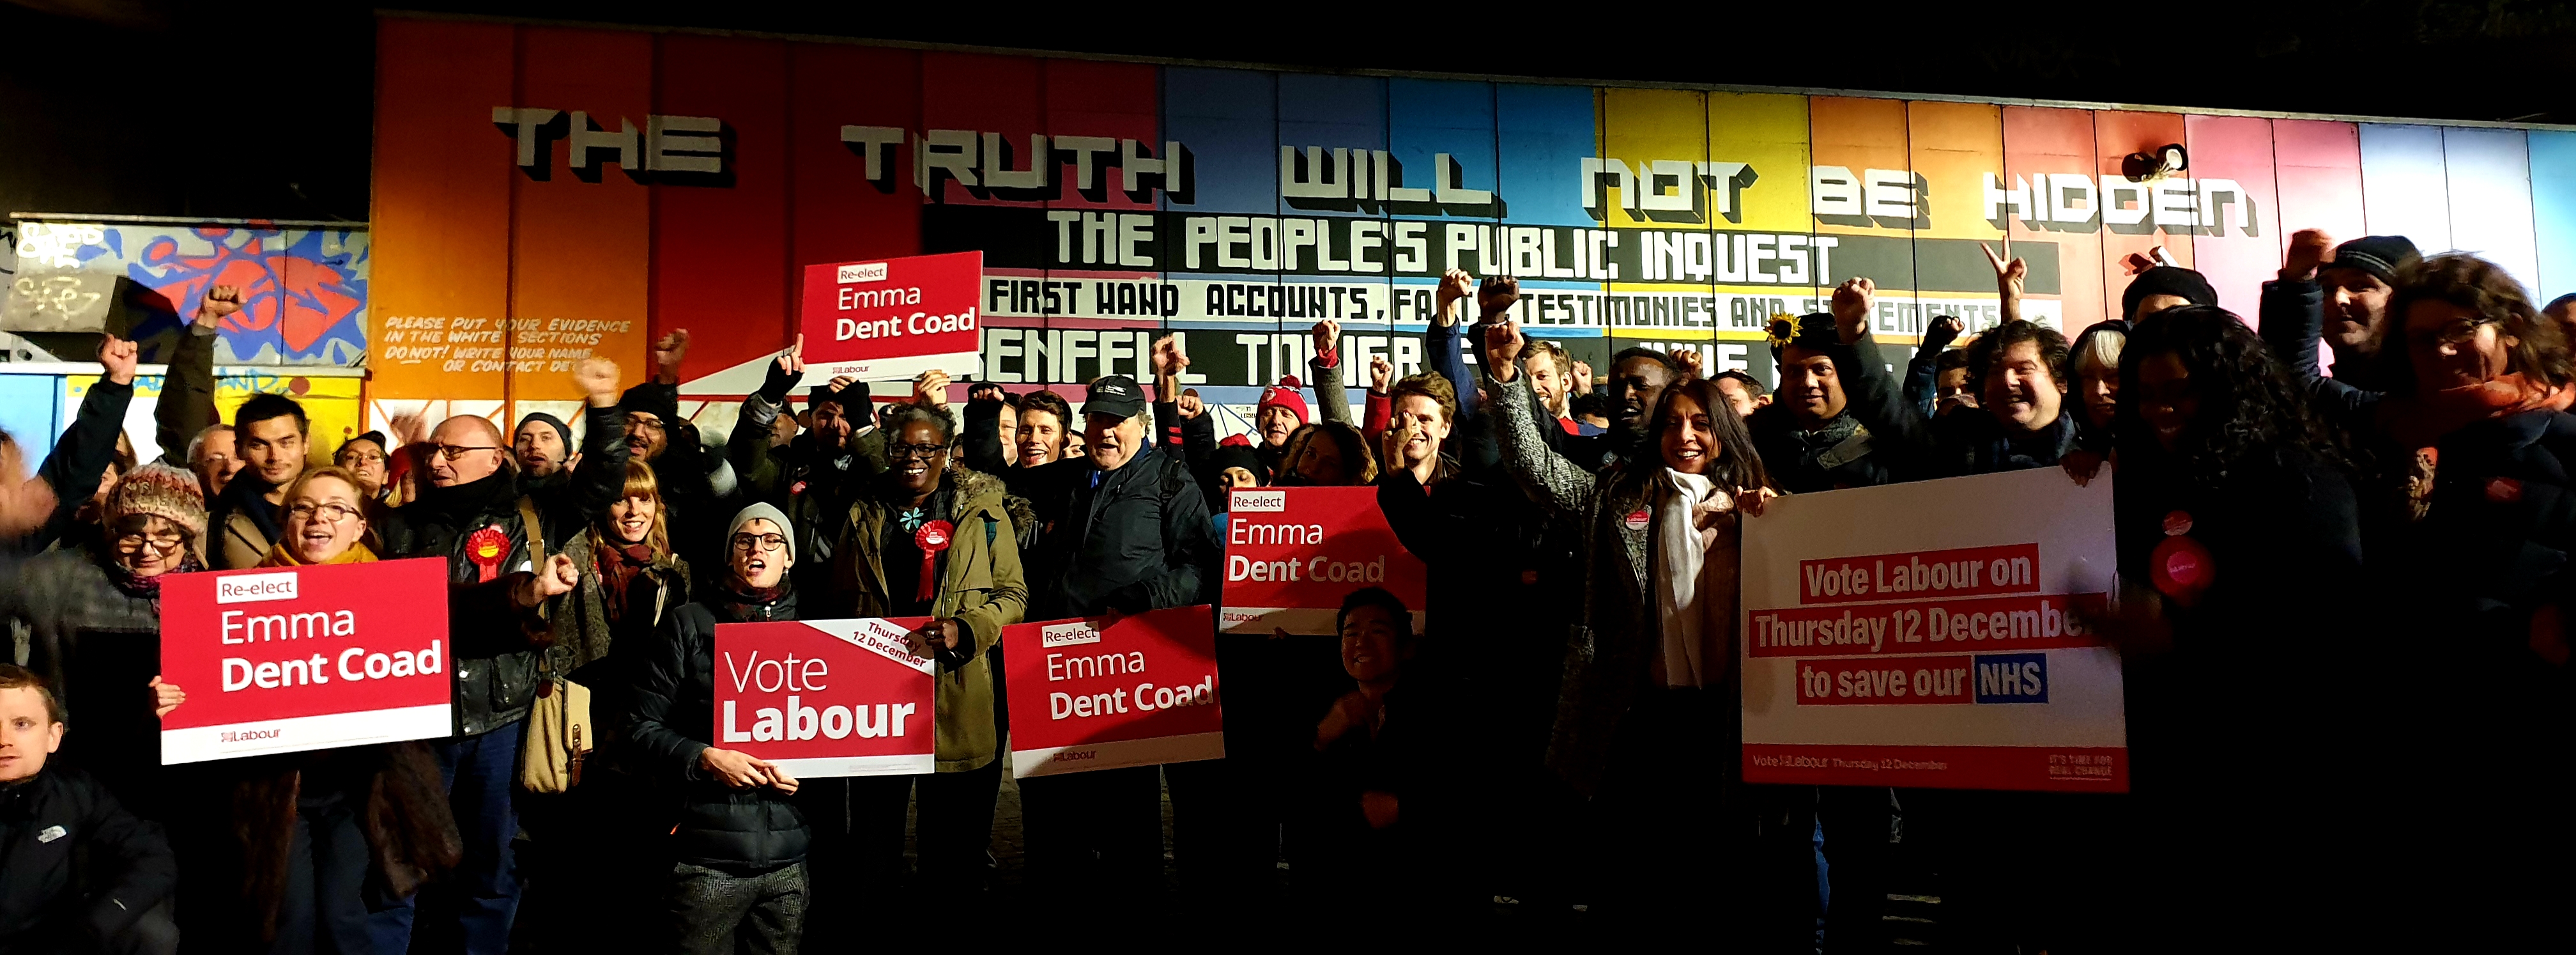
Labour activists in Kensington and Chelsea
|
|
|
|
Conservative |
Labour |
Liberal Democrats |
UKIP |
|
Year |
Region |
Turnout |
Votes (+/- share) |
Votes (+/- share) |
Votes (+/- share) |
Votes (+/- share) |
|
2019 |
London |
67.3% |
1,205,129 (+1.1%) |
1,812,810 (-6.4%) |
562,564 (+6.1%) |
_ |
|
2019 |
South |
71.1% |
4,124,956 (+0.8%) |
1,742,952 (-6.2%) |
967,207 (+5.5%) |
_ |
|
2017 |
London |
70.1% |
1,268,800 (-1.7%) |
2,087,010 (+10.9%) |
336,680 (+1.1%) |
_ |
|
2017 |
South |
69.1% |
4,069,192 (+4.1%) |
2,196,840 (+10.9%) |
933,424 ( +1.0%) |
_ |
|
2015 |
London |
65.4% |
1,233,386 (+0.3%) |
1,545,048 (+7.3%) |
272,544 (-14.4%) |
286,981 (+6.4%) |
|
2015 |
South |
69.1% |
3,554,354 (+2.6%) |
1,306,458 (+1.4%) |
842,513 (-18.7%) |
1,031,505 (+9.9%) |
|
2010 |
London |
64.6% |
1,174,568 (+2.6%) |
1,245,637 (-2.3%) |
751,561 (+0.2%) |
59,452 (+0.3%) |
|
2010 |
South |
68.6% |
3,328,532 (+4.6%) |
1,125,174 (-7.8%) |
2,087,740 (+1.5%) |
144,841 (+0.9%) |
General Election Results in London and Southern England 2010 – 2019 for main parties
(Turnout = % of eligible voters; (+/- share) = change in party’s share of vote since previous GE)


